Sales Performance by Region and Role: Insights to Drive Smarter Growth
This case study from Sanders Analytics shows how one growing B2B firm used strategic data analysis to uncover regional trends and decision-maker patterns—turning siloed data into insight that drives smarter, faster sales outcomes.
Project Snapshot
Client: A U.S.-based B2B growth firm with over 60 employees and $2.5M–$5M in annual revenue. The company works with enterprise-level clients across industries, managing complex sales cycles and nurturing high-value deals. The leadership team wanted to understand which markets and decision-makers were driving sales so they could invest in what works, cut what doesn’t, and scale smarter.
Goal: Identify regional sales strengths and opportunities across their global market
Full Report
Executive Summary
* North America is the strongest market: high deal value, fast sales cycle, and strong conversion.
* Asia, Africa, and South America are lean but efficient: lower volume, but strong internal performance suggests scalable opportunity.
* Marketing and Finance contacts outperform others in deal conversion —especially mid-level VPs and Managers.
* Sales and technical roles show lower conversion, indicating limited influence in closing.
Project Goals
The client engaged Sanders Analytics to:
- Understand how sales performance varied by geography
- Identify decision-maker patterns across roles and domains
- Lay the foundation for predictive forecasting and revenue optimization
The Challenge
The client had valuable data, but it was siloed across ZoomInfo and HubSpot. Pulling reports was manual, time-consuming, and inconsistent. Key questions like “Which regions convert fastest?” or “Who’s most likely to close a deal?” were hard to answer reliably.
To move from hunches to evidence, we began by organizing and analyzing the company’s fragmented sales data. The goal was to identify clear patterns in regional performance and sales outcomes—insights that could guide strategic decisions and day-to-day operations alike.
The interactive dashboard below visualizes those early findings, offering a live look at key metrics by region and country. These visual insights became the foundation for targeted recommendations and deeper analysis.
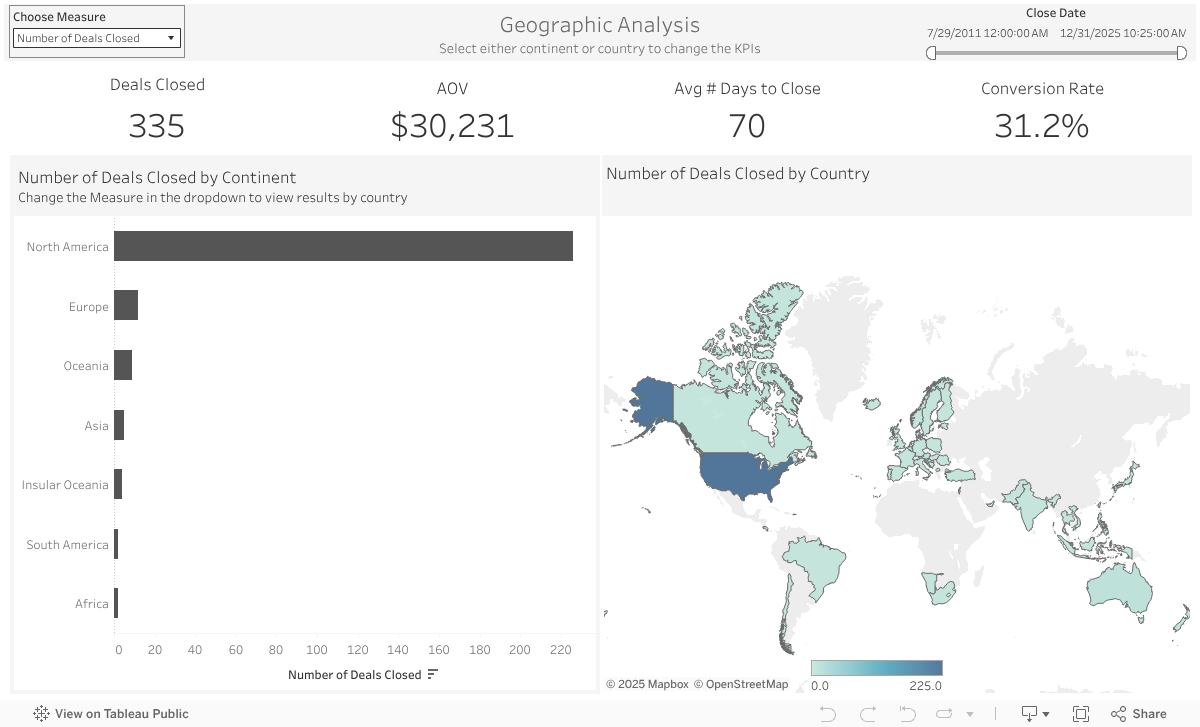
Interactive Dashboard: Sales Performance KPIs by Region
Explore deal value, conversion rate, and time to close across global markets. The dashboard makes it easy to spot high-performing regions, flag potential inefficiencies, and compare performance at a glance.
Our Approach
We started with a strategic analysis of historical sales data. After cleaning and combining records, we focused on three core questions:
- Which geographic markets drive the most value?
- How do conversion rates vary by role and department?
- Where should the business prioritize outreach and resources?
- Data Wrangling & Integration: Cleaned and merged contact- and deal-level data across platforms. Enriched country-level data to create continent-level regions for meaningful geographic analysis.
- Descriptive & Inferential Analytics: Used non-parametric testing to assess how key metrics—average order value, days to close, and conversion rate—differed across continents. Standardized metrics to assess internal efficiency and examined effect sizes.
- Role-Based Analysis: Analyzed contact conversion rates by job role and domain (e.g., Marketing Manager vs. Sales VP) using mosaic plots to reveal visual patterns.
- Clear Reporting: Delivered a polished, executive-ready report including visualizations, insights, and actionable recommendations across geographic and role-based segments.
Key Findings
- North America leads in deal size, conversion rate, and speed to close—justifying greater investment.
- Asia, Africa, and South America show high internal efficiency, suggesting scalable growth opportunities.
- Europe and Oceania lag in cycle speed and/or value, indicating the need for targeting and process improvement.
- Marketing and Finance contacts at the mid-level (e.g., Managers and VPs) have the highest conversion rates, suggesting outreach should prioritize these roles.
- Sales and technical roles (e.g., CROs, Engineers) were less likely to convert, indicating a need to rethink targeting.
| Finding | Why it matters | Recommendation |
|---|---|---|
| North America leads in deal value, conversion rate, and speed | Statistically better across all absolute sales metrics | Prioritize high-touch strategies and continued investment |
| Asia, Africa & South America show strong internal efficiency | While absolute performance is lower, standardized ratios show higher efficiency | Investigate scalable strategies —consider automation or tailored enablement |
| Europe slowest time to close | Suggests process inefficiencies or complex buying environments | Assess sales workflow, qualification criteria, and potential friction points in the pipeline |
Impact & Next Steps
With these insights, the client is now well-positioned to:
- Refocus sales and marketing efforts by region and role
- Test new outreach strategies with more strategic contact targeting
- Build a predictive model for deal success based on contact patterns
A follow-up proposal for an automated data pipeline and an interactive browser-based dashboard you can open like a webpage is now under review. This system would update weekly, enabling faster decision-making and eliminating the need for manual data prep.
Why It Matters
For SMBs with lean teams and high deal value, getting clarity on where to focus sales efforts and who to engage can dramatically reduce cycle time and increase ROI. This project demonstrates how thoughtful data analytics can turn scattered information into a competitive advantage.
Services Provided
- Data integration roadmap and pipeline proposal
- Exploratory and inferential statistical analysis
- Interactive visualizations and dashboards
- Strategic reporting with actionable recommendations
Ready to unlock insights hiding in your sales data?
Let’s turn your questions into clarity – and your data into decisions.