Retention and Outcome Analysis
I analyzed 10+ years of student retention data for a university program to understand what drives drop-off.
The tools: R, Tableau, and logistic regression.
The takeaway? Surface-level trends didn’t tell the whole story. Intersectional data analysis revealed where students were falling through the cracks.
Project Snapshot
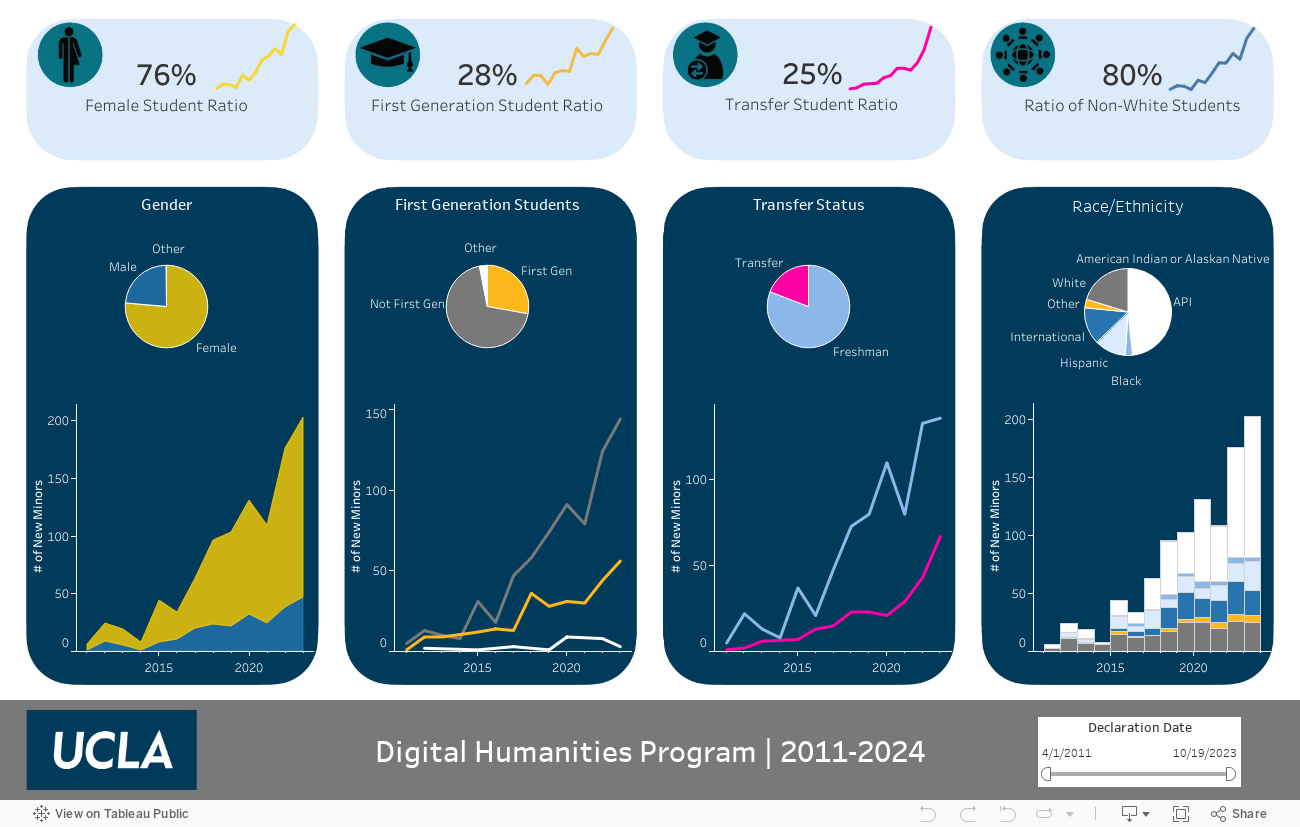
Client: A university Digital Humanities program
Goal: Understand which student groups were most and least likely to complete a competitive minor, and identify opportunities to improve outcomes
The Challenge
The client suspected some students were struggling to complete the program but lacked the data-driven insights to pinpoint which groups were most affected or why. With limited resources, they needed to identify high-impact opportunities for improvement.
Approach
I conducted an end-to-end analytics project, including:
- Data cleaning and integration across multiple sources
- Exploratory analysis of demographic trends
- Statistical modeling (logistic regression) to evaluate predictors of program completion
- Visualization of both aggregate outcomes and predictive insights to support decision-making
Importantly, I analyzed not just individual demographic factors but also how they interact, surfacing intersectional risks and successes often missed in surface-level analysis.
The dashboard below is interactive so the data can be sliced in many different ways and viewed for different periods of time using the slider in the lower right corner.
Key Findings
Once I grouped by demographics and time constraints, hidden risks appeared – just like in customer journeys.
- Overall completion rates were strong (77%), but certain subgroups lagged behind, particularly students who were URM, female, and not first-gen.
- First-generation students completed at higher rates than their continuing-gen peers.
- A statistically significant interaction revealed that URM male students, despite initial assumptions, had some of the highest predicted completion probabilities, suggesting effective, if informal, support mechanisms.
The same techniques apply to business:
➡️ Segment your customer base beyond broad averages → uncover high-value and at-risk segments.
➡️ Use predictive models to reveal hidden strengths and vulnerabilities (before they show up in revenue) → prioritize your efforts with confidence.
Impact & Next Steps
The program now has clear, data-driven direction for improving student success. Based on my recommendations, they are:
- Prioritizing early outreach to at-risk groups
- Investigating what’s working for URM male students to scale support more broadly
- Monitoring program equity with newly developed KPIs
Why It Matters
This project demonstrates how looking beyond averages and digging into overlapping identities can unlock powerful insights. It also proves that predictive analytics can reveal unexpected strengths and help programs (or businesses) focus resources where they matter most.
Services Provided
- Data strategy and transformation
- Predictive analytics (logistic regression, interaction effects)
- Custom visualization and reporting
- Strategic recommendations based on quantitative findings
Predictive analytics isn’t just for academia.
We’ll help you find what’s working, fix what’s not, and move forward with confidence.